時間的複雑さを経験的に証明する
32186 ワード
どのようにしてアルゴリズムがO ( n )(またはO(log n)またはO(1)など)であることを知っていますか?最初の(そして、正しい)答えは、分析によるものです:あなたのアルゴリズムがN項目のセットの上でループするならば、それはO(n)です;など.しかし、これを確認したいことがありますか?このように、O(1)でなければならないようなアルゴリズムを書いていますが、実世界でどのように実行するかを見たいと思います.または、配列をJSONに変換するのがO ( N )かどうかわからない.さて、実際のデータを実行し、結果を見てそれを確認することができます.
最近、グラフデータ構造を実装しなければなりませんでした.グラフは頂点で接続可能である.私はそれについて詳細には行きません、しかし、私が私の実装について読んだことは、エッジのチェックと端を取り除くことがO(V)であると主張しました(Vは、グラフの頂点の数です).これを確認したかった.
眼球テスト
まず最初に、変数(n)が何であるかを把握し、nを変化させ、他のものを一定に保つテストケースを作成します.
私のグラフの例では、簡単な操作から始めることを決めました:頂点を加えてください.変数はvで、グラフの頂点数です.私のテストはこの数を変えて、新しい頂点を加えるのにどれくらいかかるかについて見ます.
私は1000のチャンクでそれをすることに決めた.私はグラフに1000頂点を追加し、時間を測定します.ここで、Vは現在= 1000です、そして、私は次の1000、処置を再び加えます.
グラフの描画
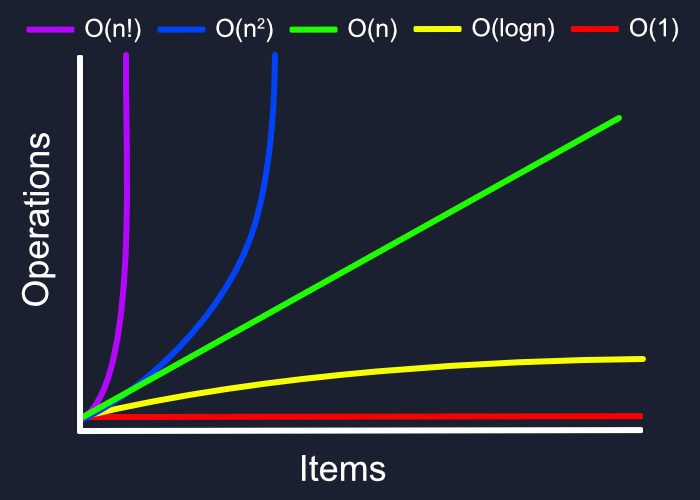
我々の実験の限界は、我々が手動で結果をチェックして、我々の頭で彼らを比較しているということです、そして、我々は精神的に200のデータ点を比較することができません.グラフ上のデータポイントをプロットします😅). 異なる時間の複雑さがdifferent graph shapesと本質的に異なる機能であることを知っているので、それは我々のものを特定するのが全く簡単でなければなりません.
グラフをプロットすることは驚くほど単純です.以下はそのコードです.
nodeplotlib
(私はこれを複数回走ったが、毎回同じ形だった.)
AHAは、今我々はハード、簡単に消化可能なデータを持っている.我々は、ランタイムが最初にいくつかの小さなスパイクと、いくつかの大きなものを後で、ほとんど一定であることがわかります.私たちが理論的なo(1)のために予想したかもしれないように、それは完全な直線ではありません、しかし現実の世界では、実行時のガベージコレクション、メモリ割り当て、他の実装の詳細に影響を与えます.私は、これがO ( 1 )であると結論できるかもしれないと思います.

注意:まだ次元を選択する必要があります
これは楽しさとかなり簡単だったが、1つのものを見て右の変数を選んでいる.この例では、我々の変数が何であったかはかなり明白でした、しかし、それはそれのように必ずしもありません.例えば、私のグラフ構造の標準的な記述では、
デモ.頂点の数を変える
このテストでは、私たちは1000の間隔でVを増やしています、そして、ランタイムは一定のままです.しかし、Eのエッジ数も0で一定のままである.我々は物事を切り替えるにはどうなりますか?我々はまだそれを得るか?
代わりにeを変化させ、vを一定に保つテストです.

ブーム、線形時間!これは確実にO(n)であり、ここでn=e、エッジ数である.グラフのエッジ数が上がるにつれて、ランタイムも上がることがわかります.
これは理論的な解析の部分がまだ重要である理由です:それはキー変数を特定するのを助けます.Nは必ずしも最も明白なことではない.
完全性のために、私が最初にテストしたかった操作からの結果は、


yup、一定時間.
最近、グラフデータ構造を実装しなければなりませんでした.グラフは頂点で接続可能である.私はそれについて詳細には行きません、しかし、私が私の実装について読んだことは、エッジのチェックと端を取り除くことがO(V)であると主張しました(Vは、グラフの頂点の数です).これを確認したかった.
眼球テスト
まず最初に、変数(n)が何であるかを把握し、nを変化させ、他のものを一定に保つテストケースを作成します.
私のグラフの例では、簡単な操作から始めることを決めました:頂点を加えてください.変数はvで、グラフの頂点数です.私のテストはこの数を変えて、新しい頂点を加えるのにどれくらいかかるかについて見ます.
私は1000のチャンクでそれをすることに決めた.私はグラフに1000頂点を追加し、時間を測定します.ここで、Vは現在= 1000です、そして、私は次の1000、処置を再び加えます.
// Generate an array of test cases for V: [0, 1000, 2000, 3000...]
const chunks = Array.from({length: 200}, (_, i) => i * 1000);

const g = new Graph();

for (let start of chunks) {
    const v = g.vertices.size;
    console.time(`Adding 1000 vertices, V = ${v}`);
    for (let i = start; i < start + 1000; i++) {
        g.addVertex(i);
    }
    console.timeEnd(`Adding 1000 vertices, V = ${v}`);
}
Adding 1000 vertices, V = 0: 3.152ms
Adding 1000 vertices, V = 1000: 0.39ms
Adding 1000 vertices, V = 2000: 1.687ms
Adding 1000 vertices, V = 3000: 0.585ms
Adding 1000 vertices, V = 4000: 1.56ms
Adding 1000 vertices, V = 5000: 0.644ms
Adding 1000 vertices, V = 6000: 0.396ms
Adding 1000 vertices, V = 7000: 3.268ms
Adding 1000 vertices, V = 8000: 0.987ms
Adding 1000 vertices, V = 9000: 0.339ms
Adding 1000 vertices, V = 190000: 0.493ms
Adding 1000 vertices, V = 191000: 0.507ms
Adding 1000 vertices, V = 192000: 0.471ms
Adding 1000 vertices, V = 193000: 0.596ms
Adding 1000 vertices, V = 194000: 0.508ms
Adding 1000 vertices, V = 195000: 0.539ms
Adding 1000 vertices, V = 196000: 1.44ms
Adding 1000 vertices, V = 197000: 0.647ms
Adding 1000 vertices, V = 198000: 0.551ms
Adding 1000 vertices, V = 199000: 0.565ms
グラフの描画
我々の実験の限界は、我々が手動で結果をチェックして、我々の頭で彼らを比較しているということです、そして、我々は精神的に200のデータ点を比較することができません.グラフ上のデータポイントをプロットします😅). 異なる時間の複雑さがdifferent graph shapesと本質的に異なる機能であることを知っているので、それは我々のものを特定するのが全く簡単でなければなりません.
グラフをプロットすることは驚くほど単純です.以下はそのコードです.
const { plot } = require('nodeplotlib');
const { performance } = require('perf_hooks');

const chunks = Array.from({length: 200}, (_, i) => i * 1000);
const g = new Graph();
const plotData = [
    {
        x: [],
        y: [],
        type: 'line',
        name: 'Time y to add 1000 vertices when there are x vertices in the graph'
    }
];

for (let start of chunks) {
    plotData[0].x.push(g.vertices.size);
    const startTime = performance.now();
    for (let i = start; i < start + 1000; i++) {
        g.addVertex(i);
    }
    plotData[0].y.push(performance.now() - startTime);
}
plot(plotData);
nodeplotlib
(私はこれを複数回走ったが、毎回同じ形だった.)
AHAは、今我々はハード、簡単に消化可能なデータを持っている.我々は、ランタイムが最初にいくつかの小さなスパイクと、いくつかの大きなものを後で、ほとんど一定であることがわかります.私たちが理論的なo(1)のために予想したかもしれないように、それは完全な直線ではありません、しかし現実の世界では、実行時のガベージコレクション、メモリ割り当て、他の実装の詳細に影響を与えます.私は、これがO ( 1 )であると結論できるかもしれないと思います.
注意:まだ次元を選択する必要があります
これは楽しさとかなり簡単だったが、1つのものを見て右の変数を選んでいる.この例では、我々の変数が何であったかはかなり明白でした、しかし、それはそれのように必ずしもありません.例えば、私のグラフ構造の標準的な記述では、
removeEdge()はO(V)であり、一方removeVertex()はO(E)であった(Eはエッジの数).(より高度な操作はO ( v + e )であった.あなたが間違った変数を選ぶならば、あなたは誤解を招く結果を得ます.デモ.頂点の数を変える
removeVertex()操作のテストです.const plotData = [
{
x: [],
y: [],
type: 'line',
name: `Time y to remove 1000 vertices when there are x vertices in the graph`
}
];
const chunks = Array.from({length: 200}, (_, i) => i * 1000);
for (let start of chunks) {
const g = new Graph();
// First, add the number of vertices, V
let numberOfVertices = 0;
for (let i = 0; i < start + 1000; i++) {
g.addVertex(i);
numberOfVertices++;
}
plotData[0].x.push(numberOfVertices);
// Then remove the first 1000 vertices
const startTime = performance.now();
for (let i = 0; i < 1000; i++) {
g.removeVertex(i);
}
plotData[0].y.push(performance.now() - startTime);
}
plot(plotData);
このテストでは、私たちは1000の間隔でVを増やしています、そして、ランタイムは一定のままです.しかし、Eのエッジ数も0で一定のままである.我々は物事を切り替えるにはどうなりますか?我々はまだそれを得るか?
代わりにeを変化させ、vを一定に保つテストです.
// I adjusted the chunk interval and number of chunks to 100 each so it doesn't take forever.
const chunks = Array.from({length: 100}, (_, i) => i * 100);
const plotData = [
    {
        x: [],
        y: [],
        type: 'line',
        name: `Time y to remove 100 vertices when there are x edges in the graph`
    }
];

for (let start of chunks) {
    const g = new Graph();

    // First, add all the vertices
    for (let i = 0; i < chunks[chunks.length - 1] + 100; i++) {
        g.addVertex(i);
    }

    // Then add the number of edges, E, to the first 100 vertices
    let numberOfEdges = 0;
    for (let i = 0; i < 100; i++) {
        for (let j = 0; j < start; j++) {
            if (i !== j) {
                g.addEdge(i, j);
                numberOfEdges++;
            }
        }
    }
    plotData[0].x.push(numberOfEdges);

    // Now remove the first 100 vertices
    const startTime = performance.now();
    for (let i = 0; i < 100; i++) {
        g.removeVertex(i);
    }
    plotData[0].y.push(performance.now() - startTime);
}
plot(plotData);
ブーム、線形時間!これは確実にO(n)であり、ここでn=e、エッジ数である.グラフのエッジ数が上がるにつれて、ランタイムも上がることがわかります.
これは理論的な解析の部分がまだ重要である理由です:それはキー変数を特定するのを助けます.Nは必ずしも最も明白なことではない.
完全性のために、私が最初にテストしたかった操作からの結果は、
hasEdge()です.VとEに対するテスト// First test: V varies, E constant
function hasEdgeTestOverV() {
const chunks = Array.from({length: 200}, (_, i) => i * 100);
const plotData = [
{
x: [],
y: [],
type: 'line',
name: 'Time y to check for 100 edges when there are x vertices in the graph'
}
];
for (let start of chunks) {
const g = new Graph();
// First, add V vertices
for (let i = 0; i < start + 100; i++) {
g.addVertex(i);
}
plotData[0].x.push(g.vertices.size);
// Then check for edges in the first 100 vertices
const startTime = performance.now();
for (let i = 0; i < 100; i++) {
g.hasEdge(i, i + 1);
}
plotData[0].y.push(performance.now() - startTime);
}
plot(plotData);
}
// Second test: E varies, V constant
function hasEdgeTestOverE() {
    const chunks = Array.from({length: 200}, (_, i) => i * 100);
    const plotData = [
        {
            x: [],
            y: [],
            type: 'line',
            name: 'Time y to check for 100 edges when there are x edges in the graph'
        }
    ];

    for (let start of chunks) {
        const g = new Graph();

        // First, add all the vertices
        for (let i = 0; i < start + 100; i++) {
            g.addVertex(i);
        }

        // Then add the number of edges, E, to the first 100 vertices
        let numberOfEdges = 0;
        for (let i = 0; i < 100; i++) {
            for (let j = 0; j < start; j++) {
                if (i !== j) {
                    g.addEdge(i, j);
                    numberOfEdges++;
                }
            }
        }
        plotData[0].x.push(numberOfEdges);

        // Then check for edges in the first 100 vertices
        const startTime = performance.now();
        for (let i = 0; i < 100; i++) {
            g.hasEdge(i, i + 1);
        }
        plotData[0].y.push(performance.now() - startTime);
    }

    plot(plotData);
}
yup、一定時間.
Reference
この問題について(時間的複雑さを経験的に証明する), 我々は、より多くの情報をここで見つけました https://dev.to/shalvah/proving-time-complexity-empirically-3h9eテキストは自由に共有またはコピーできます。ただし、このドキュメントのURLは参考URLとして残しておいてください。
Collection and Share based on the CC Protocol